|
This web page is prepared for providing research materials of our project on
overlap-free network labeling based on voronoi tessellation.
|
Removing unwanted overlaps of node labels |
|
Networks can successfully capture meaningful features hidden behind abstract data, such as social friendships, research co-authorships, co-purchasing relationships, etc.
Thus, visualizing networks is considered a promising approach to enhancing the readability of the underlying abstract relationships.
The force-directed approach is one such representative technique; it applies repulsive and attractive forces to the nodes and edges of the network and then seeks the finalized network layout as its equilibrium state.
Nonetheless, once we try to annotate the network nodes with text labels,
we inevitably struggle against distracting visual clutter arising from the occlusions of such annotation labels due to the lack of labeling space around the respective nodes.
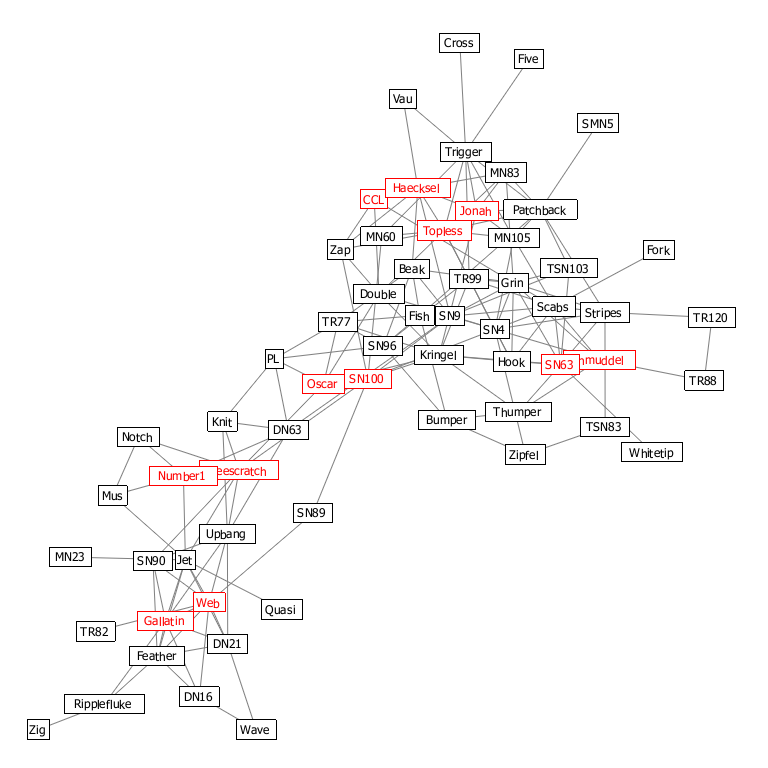
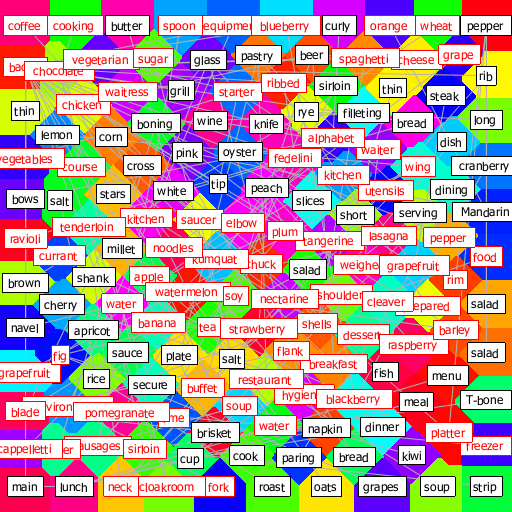
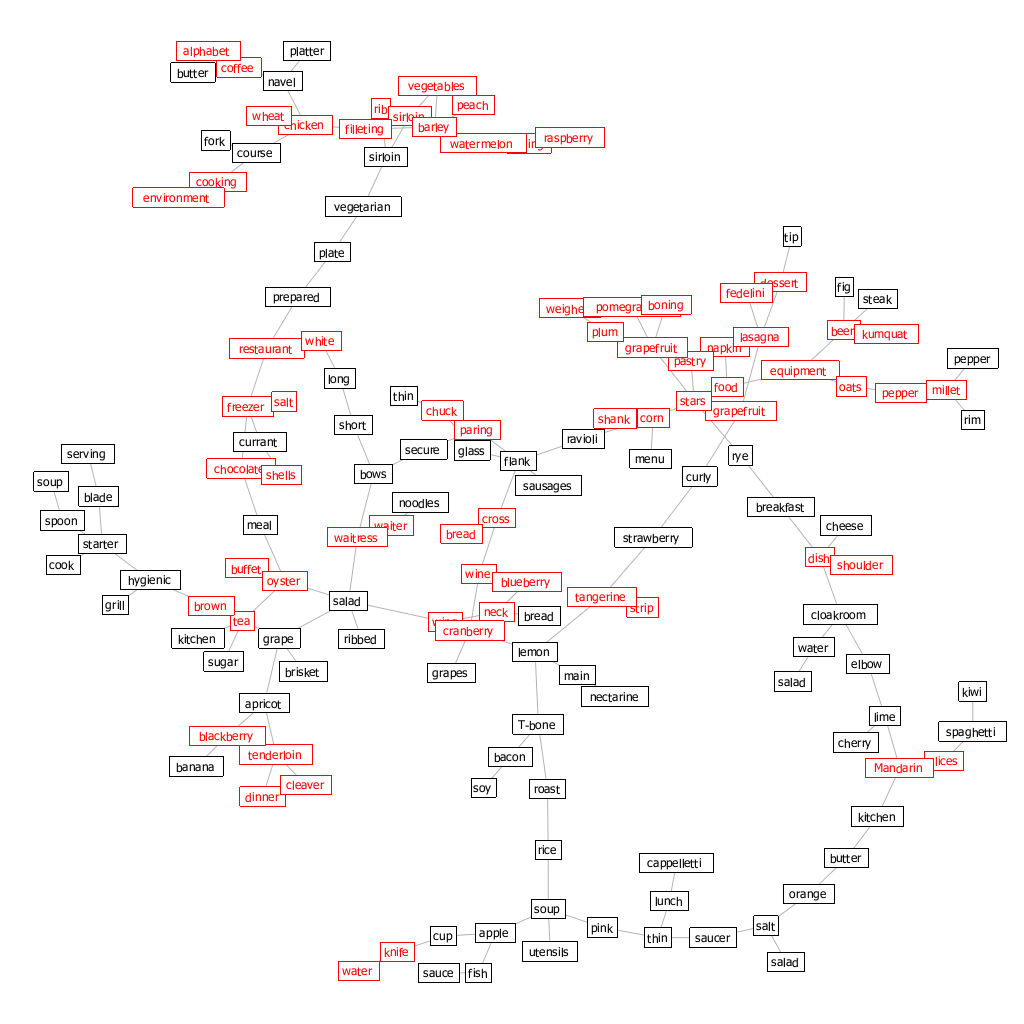
In this project, we introduced an approach to overlap-free network labeling by sparing sufficient labeling space around the network nodes. This is accomplished by seeking an adaptive compromise between the layouts obtained through the conventional force-directed approach and through centroidal Voronoi tessellation. An anisotropic Chebyshev distance metric is incorporated into the Voronoi tessellation in order to fully respect the rectangular shapes of text labels associated with the network nodes. Fig. 1 presents such an example where our approach can yield a visually plausible layout of an annotated network (Fig. 1(b)) by exploring a reasonable compromise between the force-directed layout (Fig. 1(a)) and space partitioning based on the Voronoi tessellation (Fig. 1(c)). As shown in the figure, our approach will compose a compact layout that is relatively close to the original force-directed layout. Furthermore, we can maximally retain the aesthetic criteria induced from the conventional force-directed layout while suppressing undesirable artifacts such as unequal lengths of edges and small angles between adjacent edges, which often arise from space partitioning schemes based on the Voronoi tessellation (Fig. 1(c)). |
|
||||||
|
Fig. 1:
Network layouts of social relationships among dolphins.
(a) A force-directed layout.
(b) A layout generated by our approach.
(c) A layout based on centroidal Voronoi tesselation.
Annotation labels having overlaps with others are drawn in red.
|
Enhancement of the distance metric |
|
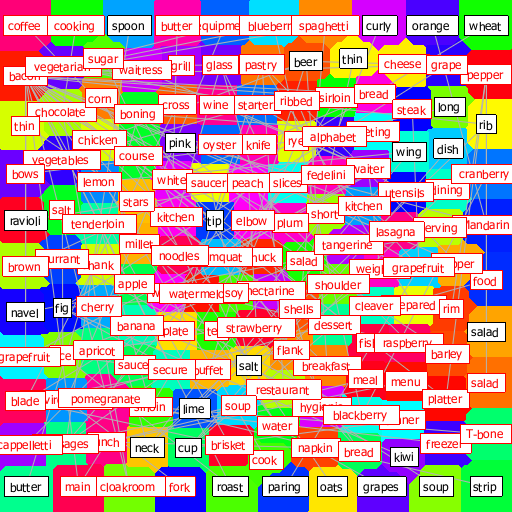
We conducted several enhancements in our choice of the distance metric for generating the Voronoi tessellation to establish a better arrangement of annotation labels.
First,
we have tested the Euclidean, Manhattan, and Chebyshev distances in order to identify the most appropriate distance metric when placing these rectangular node labels.
Suppose that we consider the distances between the two nodes
and
.
These three types of distances are defined as follows:
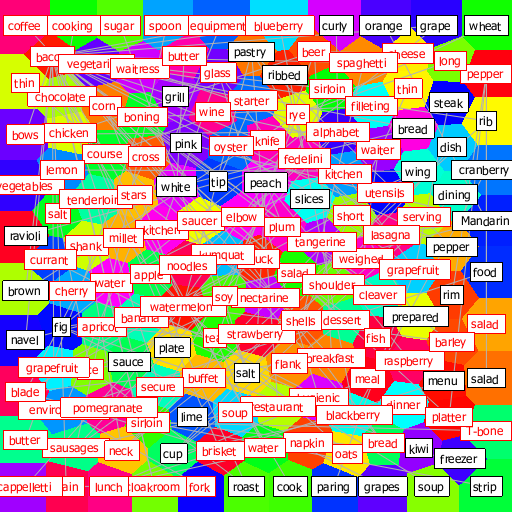
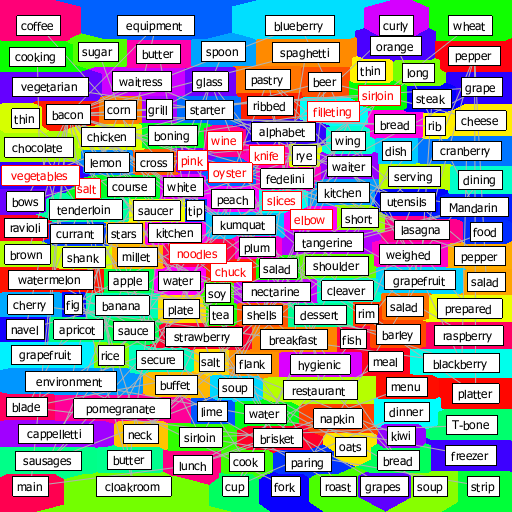
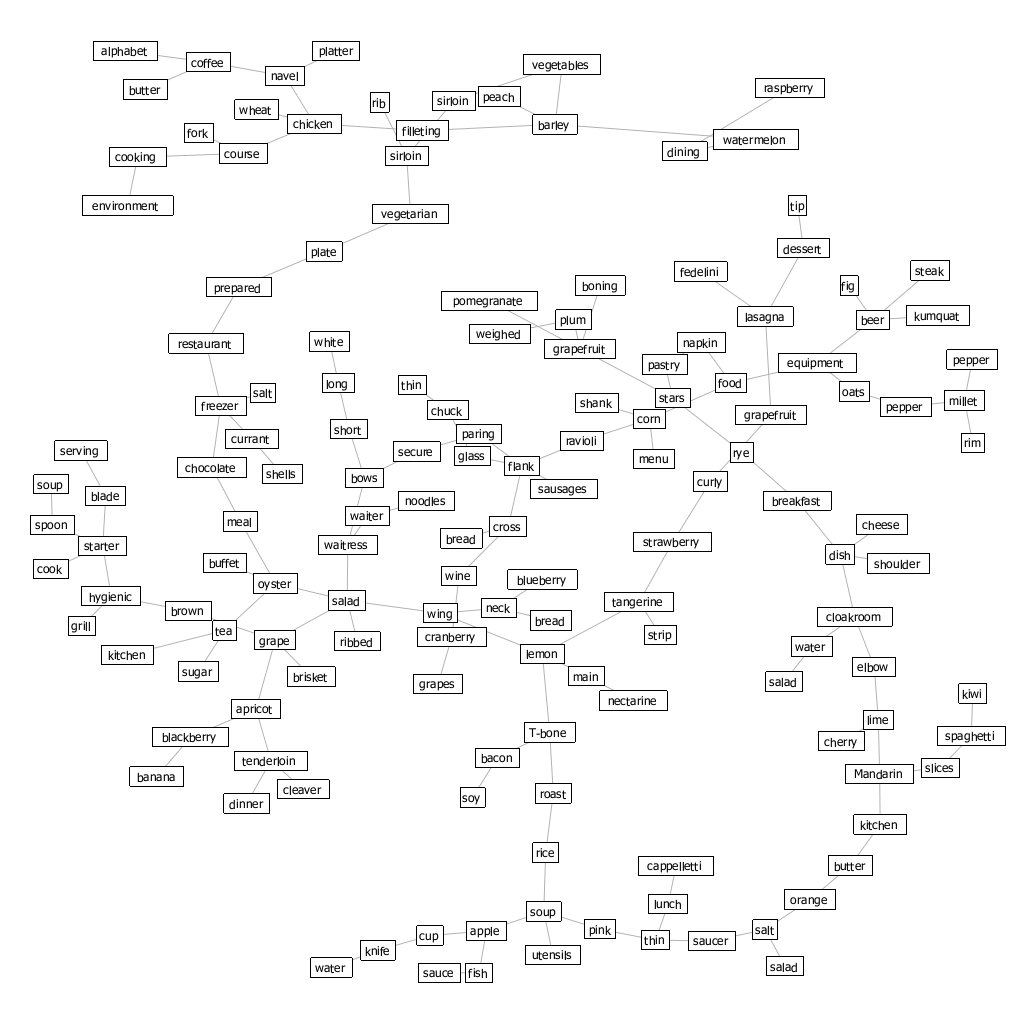
Here, the distance metrics , , and correspond to the Euclidean, Manhattan, and Chebyshev distance metrics, respectively. We also changed the aspect ratios of the individual Voronoi cells according to the size of the corresponding text labels, in such a way that the cell becomes horizontally long to accommodate text labels. In our approach, we incorporated anisotropy to each distance metric, which allows us to rewrite the definition of the distance metrics as: , where indicates the aspect ratio of the horizontal side of the corresponding label with respect to its vertical side. We tested the three distance metrics and their isotropic and anisotropic versions by investigating how many labels they can accommodate without overlaps within the fixed screen space, as shown in Fig. 2. The comparison indicates that the anisotropic version of the Chebyshev distance metric is the best in the sense that the associated Voronoi tessellation successfully accommodates the largest number of labels without unwanted occlusions. We, therefore, decided to employ this distance metric when composing the Voronoi tessellations in our approach. |
|
||||||||||||
|
Fig. 2:
Label packing based on centroidal Voronoi tessellation. Labels colored in red have overlap with other labels. The choice of the distance metric and anisotropy has a significant impact on the number of occluded labels.
|
Results |
|
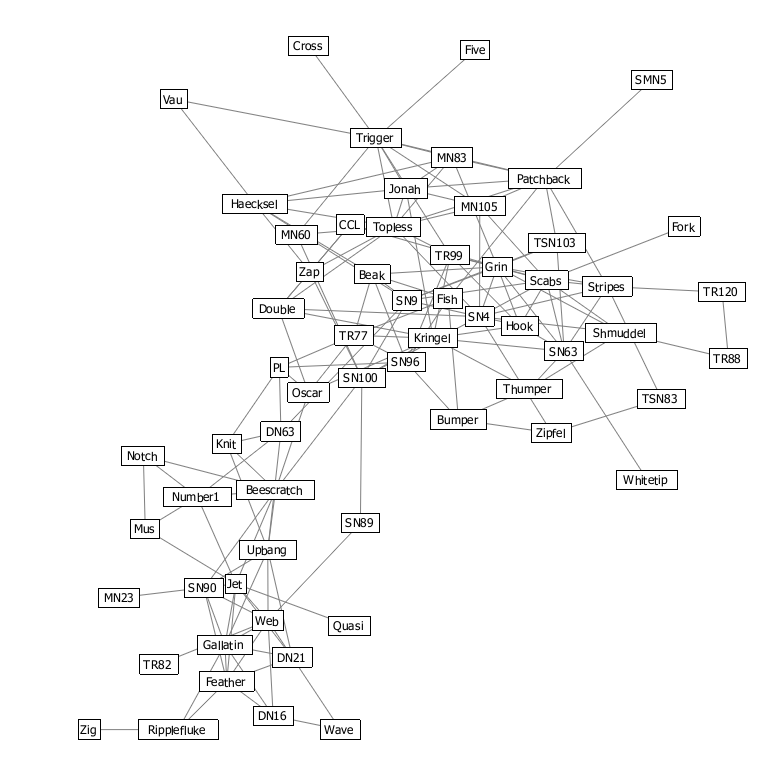
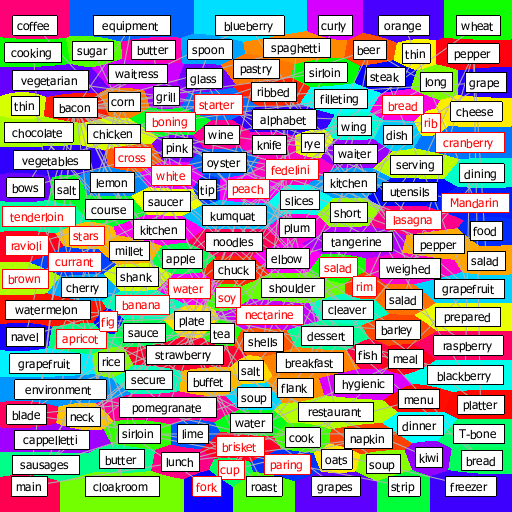
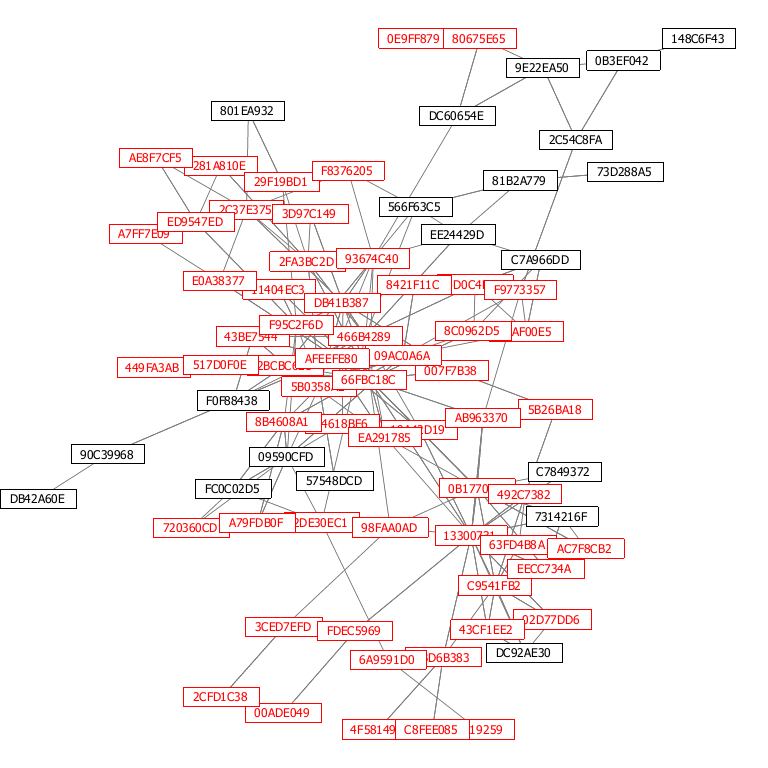
Fig. 3 provides a visual comparison among three layouts produced by the conventional force-directed approach, the present approach, and the previous work that simulates the arrangement of Voronoi cells, for the medium-sized network "b124."
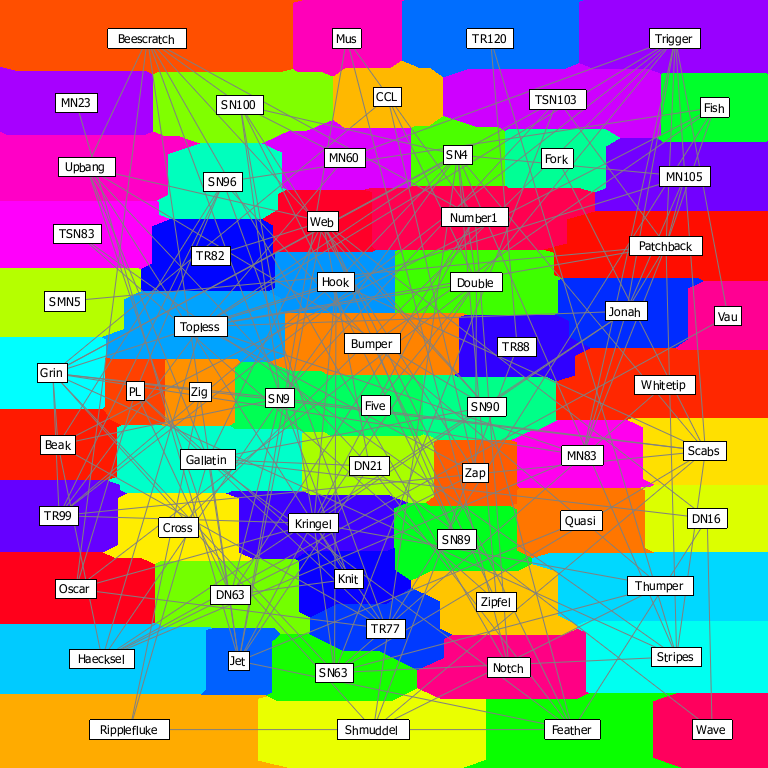
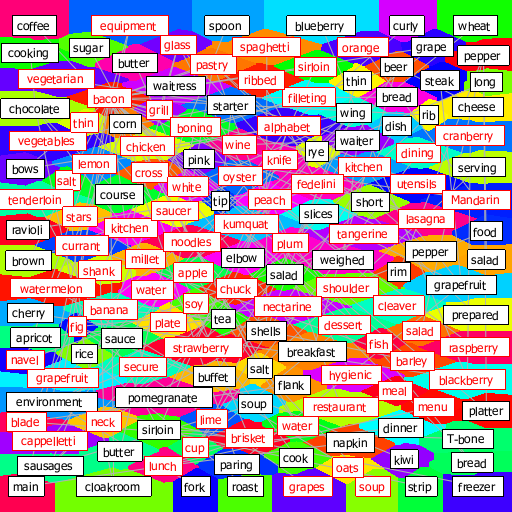
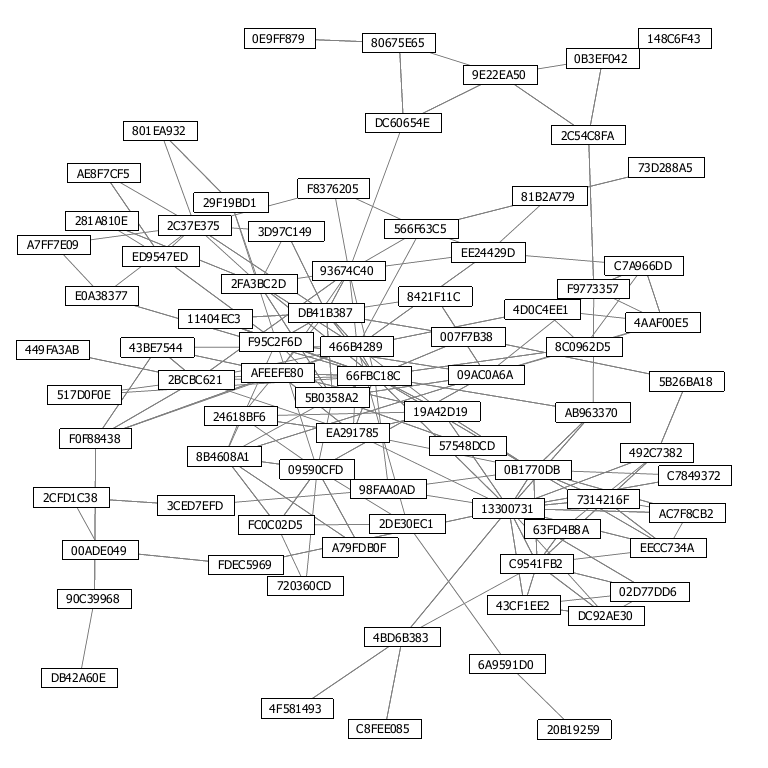
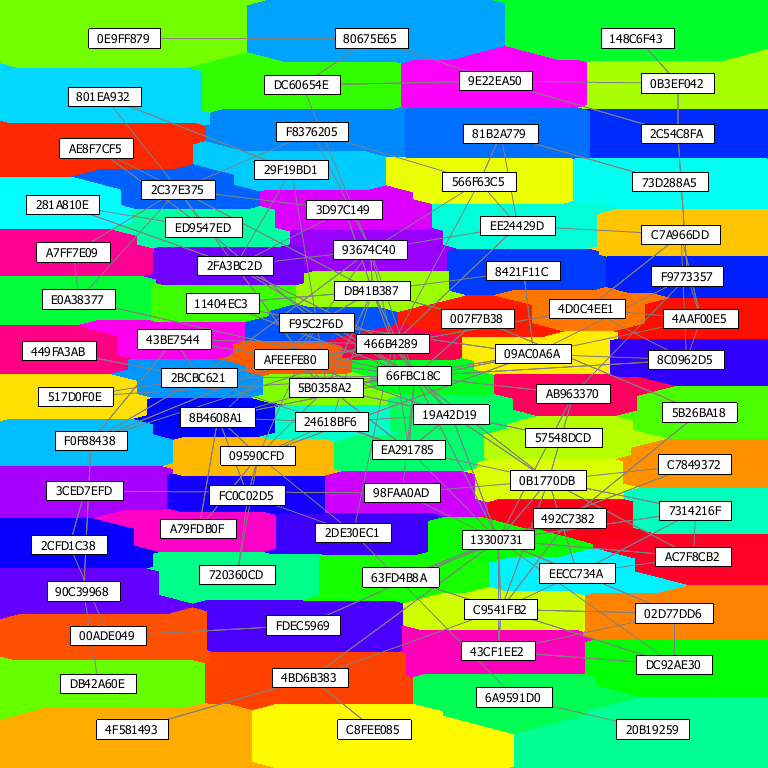
We also tested our proposed approach by applying it to a small-world network as shown in Fig. 4.
These comparisons clarify that our approach can establish a reasonable compromise between the layout obtained through the force-directed approach and that obtained through centroidal Voronoi tessellation, and it can thus successfully maintain the overall configuration of force-directed layouts while sparing sufficient labeling space around the respective nodes.
|
|
||||||
|
Fig. 3:
Visualizing the "b124" network data
(,
).
(a) A layout obtained using the force-directed algorithm (O = 5.9%).
(b) A layout obtained using our proposed approach (T = 13.1 sec, O = 0.0%).
(c) A layout obtained that simulate the centroidal Voronoi tessellation where each cell is rendered in a different color (O = 0.0%).
Here, ,
,
T, and O represent the number of vertertices, number of edges, computation time, and percentage of the overlaps with respect to the total area of the labels.
|
|
||||||
|
Fig. 4:
Visualizing a small world network data
(,
).
(a) A layout obtained using the force-directed algorithm (O = 2.7%).
(b) A layout obtained using our proposed approach (T = 8.7 sec, O = 0.0%).
(c) A layout obtained that simulate the centroidal Voronoi tessellation where each cell is rendered in a different color (O = 0.0%).
Here, ,
,
T, and O represent the number of vertertices, number of edges, computation time, and percentage of the overlaps with respect to the total area of the labels.
|
PapersHsiang-Yun Wu, Shigeo Takahashi, and Rie Ishida, Overlap-Free Labeling of Clustered Networks Based on Voronoi Tessellation, Journal of Visual Languages & Computing, Vol. 44, pp. 106-119, 2018. [PDF], [DOI: 10.1016/j.jvlc.2017.09.008].Rie Ishida, Shigeo Takahashi, and Hsiang-Yun Wu, Adaptive Blending of Multiple Network Layouts for Overlap-Free Labeling, In Proceedings of the 20th International Conference on Information Visualisation (IV2016), Lisbon, Portugal, (July, 2016), pp. 15-20, 2016. [PDF], [DOI: 10.1109/IV.2016.25].Rie Ishida, Shigeo Takahashi, and Hsiang-Yun Wu, Interactively Uncluttering Node Overlaps for Network Visualization, In Proceedings of the 19th International Conference on Information Visualisation (IV2015), Barcelona, Spain, (July, 2015), pp. 200-205, 2015. [PDF], [DOI: 10.1109/iV.2015.44]. |